Everyone who uses Facebook as a promotion channel, is familiar with the statistics displayed in the Ads Manager. Of course, an understanding of how much a click cost, what kind of coverage and the number of views received from an advertising campaign, the information is important. However, it is even more useful to know what happened after, how the consumer behaves after the click. This data Ads Manager misses.
Google Analytics is great for an objective assessment of the effectiveness of advertising. Using the tool you can track user actions performed on the website. Understand what the buyer is guided by, what caused the purchase. Here are some reasons why you might asking yourself about analytics right now:
This is why Google Analytics is the most popular platform for tracking Facebook advertising campaigns. Later, we’ll tell you about a way to integrate these two systems in one digital analytics instrument.
In this article, we’ll tell you:
[insert page='how-to-use-instagram-as-a-weapon-in-your-content-promotion-strategy' display='single-related-article-02.php']
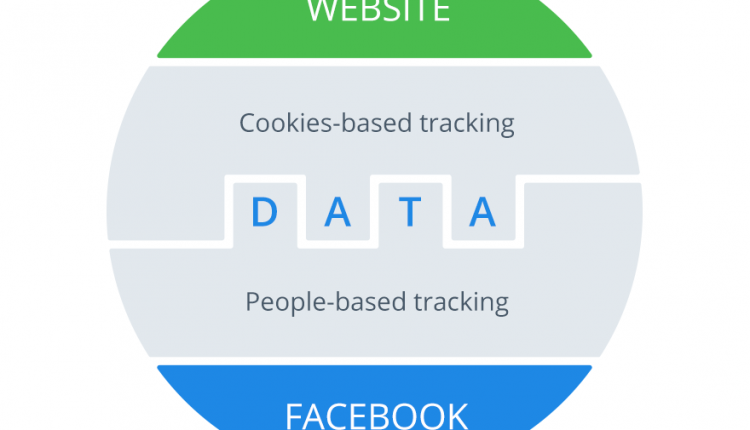
If you’re experienced, want full-stack analytics, and are ready for an out-of-the-box solution, try OWOX BI. There are no risks of manual integrations, OWOX BI just works and saves you a great amount of time.
Let’s see what do you want to track with a help of Google Analytics or Facebook. What’s your main need? What are your aims? The deeper we go into these questions, the more details we reveal.
| Analytics you need | The data flow you need |
| Reach, views, clicks, separate promotion cost, events cost | Facebook Business & Facebook Pixel
|
| Views, clicks, ad costs, conversions, customer behavior tracking, comparative analysis with other channels, audience, geo, device, landing page reports, etc. | FB → GA
|
| All possible custom reports without data sampling | FB → GA → GBQ
|
OWOX BI has created the Facebook to Google Analytics and Facebook to Google BigQuery pipelines to make your work with data easy and to let you completely concentrate on insights from reports. Or else you need to dive into detailed instruction and take up to 10 steps to at least upload data manually in your GA.
But if you want to know how you can do all these steps by yourself, read the instructions below!
To start tracking Facebook advertising campaigns in Google Analytics, you have to ensure that your website has a GA or GTM tracking code on each page you want to track. Also, administrator permissions are a must for all of your Google Analytics activities.
Keep in mind that with GA, you’ll be able to track only your campaigns, pages, and personal account activities in tight connection with your website. You won’t be able to say for sure what people are doing before clicking the link to your website, for instance. But you can install a Facebook Pixel to track the cost of events on the Facebook side. And you can set goals and conversions in GA. Keep in mind that both of these systems have the same settings. This is necessary for further importing data and uniting it in one database.
Also, you need to prepare an advertising campaign on Facebook and set it up especially for GA:
UTM parameters are the key to working with different types of advertising campaigns on Facebook. If you create your UTMs correctly, the data will be marked properly and you’ll get the reports you want.
So let’s get started!
[insert page='top-15-social-media-tools-for-marketers' display='single-related-article.php']
Use a spreadsheet (Google Sheets, Excel, LibreOffice Calc, etc.) to start. Place all the URLs you need in one column and ensure that they lead to your website with Google Analytics installed. You can also include things other than URLs that you need to track for the advertising campaign. Add a Visit the Website button or the URLs of your main web page to the informational block of your business page. All of these URLs will be like entrance points from Facebook to your website where Google Analytics will collect traffic data.
At last we’ll explain what UTM is! You’ve seen it as a long tail or URL text while clicking on ads and proceeding to another page. So what kind of information can be included in URLs with UTMs?
Here’s a table showing types of UTM parameters:
| UTM parameter | Syntax | Meaning |
| Source | utm_source | Where your traffic is coming from |
| Medium | utm_medium | The platform you’re using |
| Name | utm_campaign | The marketing campaign of this message |
| Term (Optional) | utm_term | What term you’ve set in ad campaign |
| Content (Optional) | utm_content | Which pieces of content this link leads to |
That’s enough to track even the most complicated Facebook campaigns.
As UTM parameters and the creation of infused URLs are virtuoso tasks, let’s leave this to a special service: Google Analytics URL Builder.
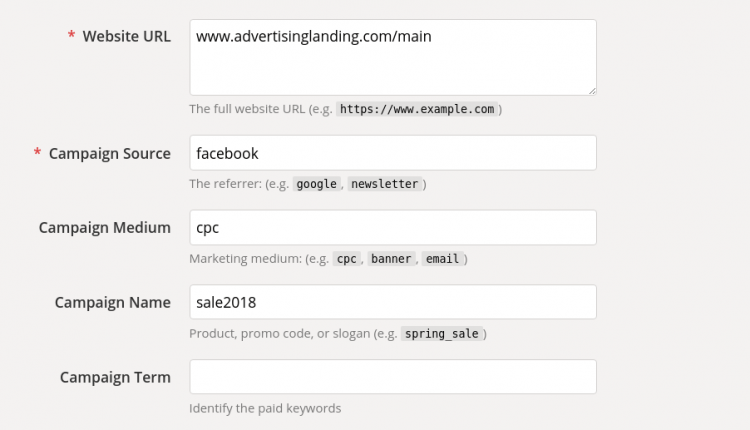
Let’s look at how the table in your spreadsheet might look:
| Link | Source | Medium | Campaign | Ready-to-use link |
| www.owox.com | social | simplefacebooktraffic | www.owox.com?utm_source=facebook&utm_medium=social&utm_campaign=simplefacebooktraffic | |
| www.owox.com/sale | cpc | sale2018 | www.owox.com/sale?utm_source=facebook&utm_medium=cpc&utm_campaign=sale2018 | |
| www.owox.com/main | cpc | sale2018 | www.owox.com/main?utm_source=facebook&utm_medium=cpc&utm_campaign=sale2018 |
The last column is the URL you should use in your campaigns. Is that too complicated for you? If so, use dynamic parameters. What’s most important is to use them in the URL and point out which parameter you’d like to track in your campaign.
You can choose dynamic parameters in the Facebook Ads Manager.
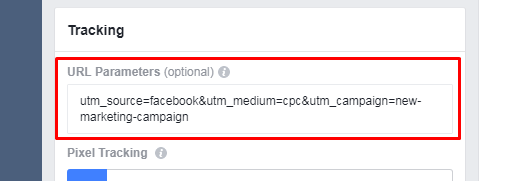
Remember the syntax:
| Meaning | Syntax | |||
| The ID of the minimal elements of an advertisement: links from texts, pictures, etc. | ad_id={{ad.id}} | |||
| The ID of the adset — ad settings with different audiences, targeting behavior, etc. | adset_id={{adset.id}} | |||
| The campaign ID | campaign_id={{campaign.id}} | |||
| Names of entities (better not to change them after the campaign is launched) |
|
So what’s the difference between static and dynamic parameters, you’re wondering? With dynamic parameters, Facebook will try to fill in the parameters you’ve requested. If you’re new to this, try it yourself to understand how this is reflected in your GA reports.
That’s the minimum you need to know for any type of Facebook and Google Analytics integration.
Let’s presume that the UTM stage is done. The next steps are:
Open your Google Analytics account. Go to Acquisition → Campaigns → All Campaigns.
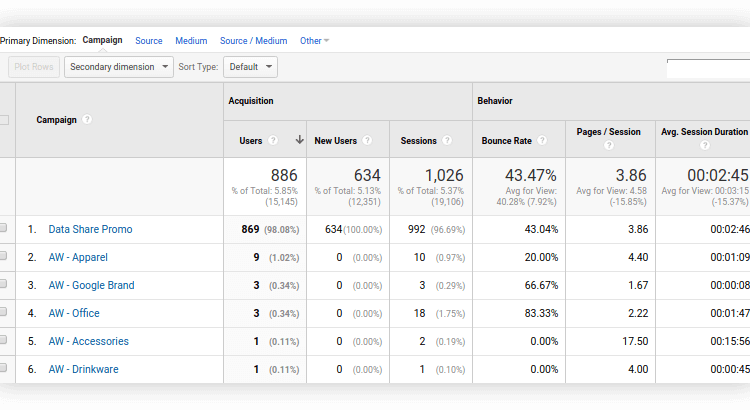
Then filter the view with the Source/Medium primary dimension. Or use the small search bar and type the Campaign Name you’ve used in your UTM tags.
You can also create the segment or a custom filter for social media campaigns or see how people are led to the checkout in Acquisition → Social → User Flow.
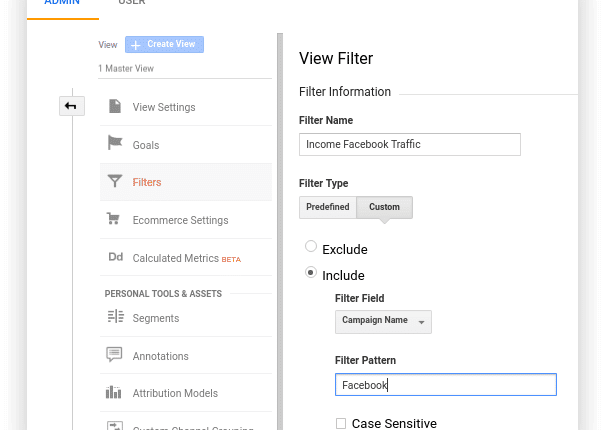
You can create a simple custom filter that contains only incoming Facebook traffic. It will help you to break down the data and get through it easier. Be aware that filters on the property level will ignore data that doesn’t match this filter and that you’ll lose filtered data in this property. So it’s better, easier, and safer to use segments.
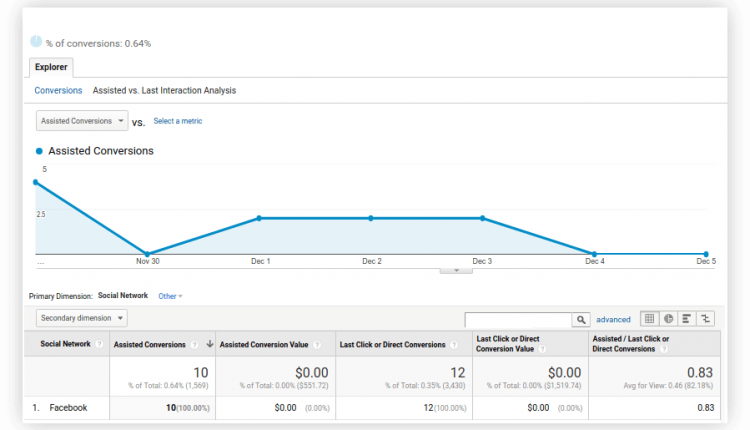
In Acquisition → Social → Conversions → Facebook → Assisted vs Last Interaction Conversions you can find some insights, too.
But without further integration of cost data you won’t see much regarding the value of your ads results, as you won’t be able to see profitability. So let’s go a little further to calculate ROAS with the help of cost data import.
There are two ways to do this. You can set it up manually or use OWOX BI. But manual setup without preparation and a complete understanding of the process often leads to errors in reports and additional worries.
Let’s see how we can track Facebook cost data in Google Analytics manually.
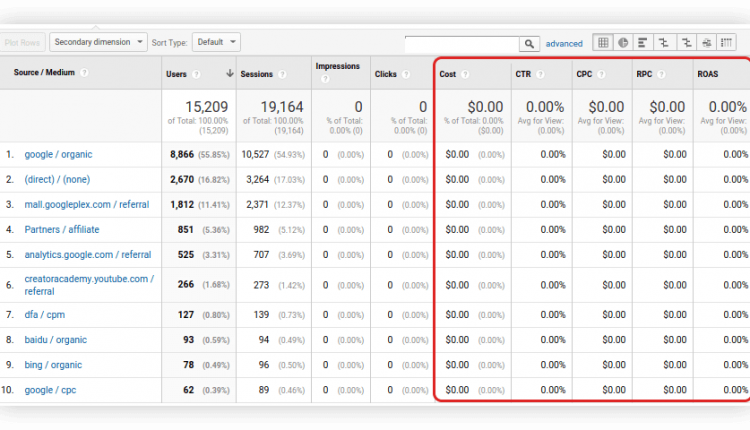
Let’s filter by facebook in the search line and see our campaigns for a certain period. Those zeros are okay, even if they’re quite depressing. These are campaigns we hope to enrich with cost data.
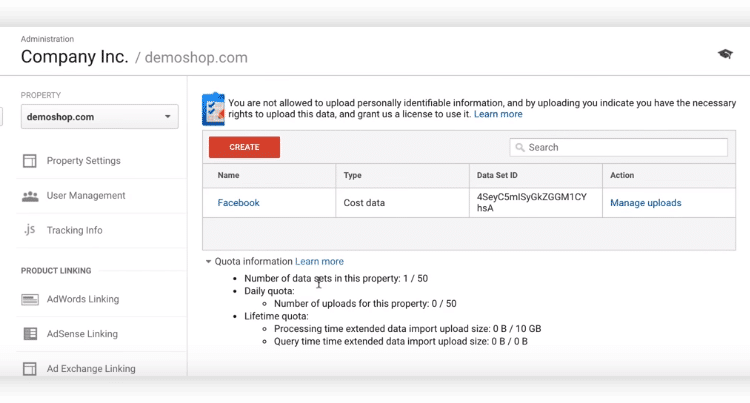
This is the main menu where you can add cost data.
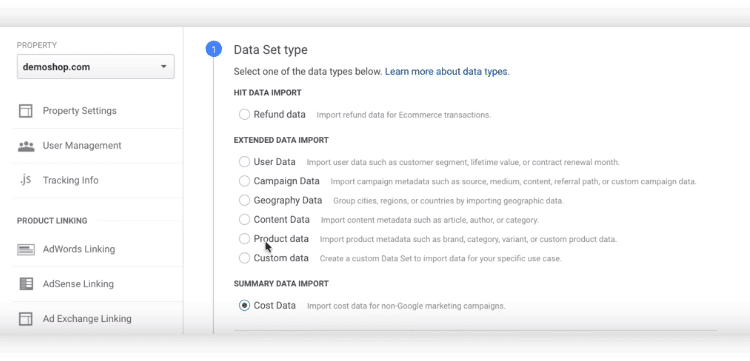
You should now be in the Data Set schema settings. Choose Cost data. Name it and choose the views in which you want to implement this piece of cost data. The next step shows you the requirements for the data schema that must be in a spreadsheet you need to prepare to work properly.
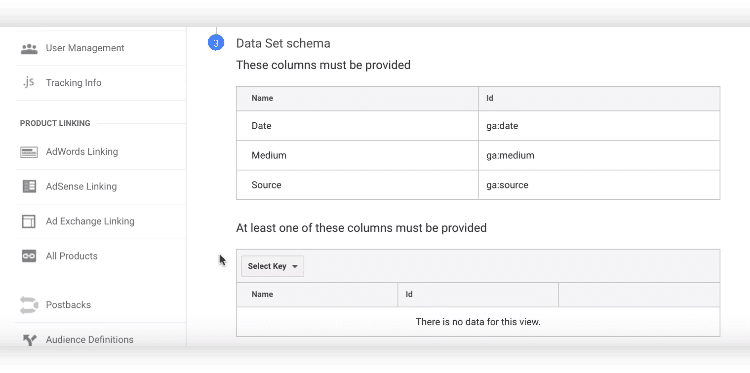
As you can see, the date, medium, and source must be provided in your import spreadsheet. You must also add cost, clicks, and impressions lines in any combination. You can add additional fields at the bottom of the settings. Select Import Behavior from the Summation or Rewrite data uploading rules.
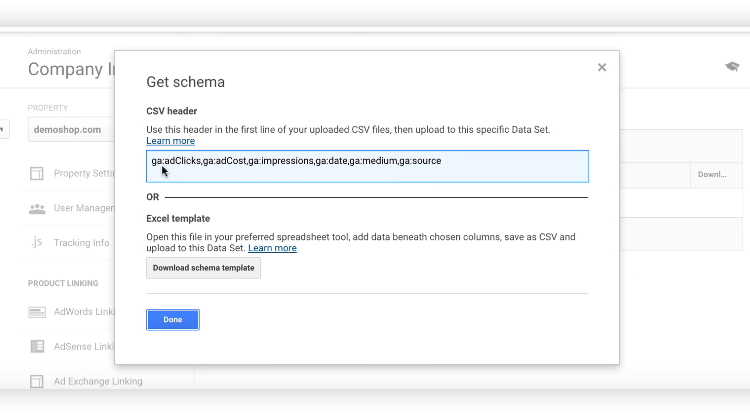
This will download an Excel template. Feeling exhausted already?
We are too.
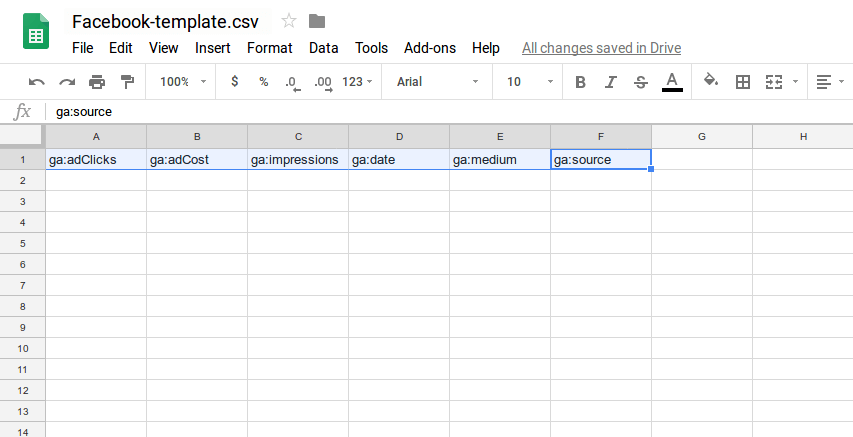
And the most interesting part is filling these columns.
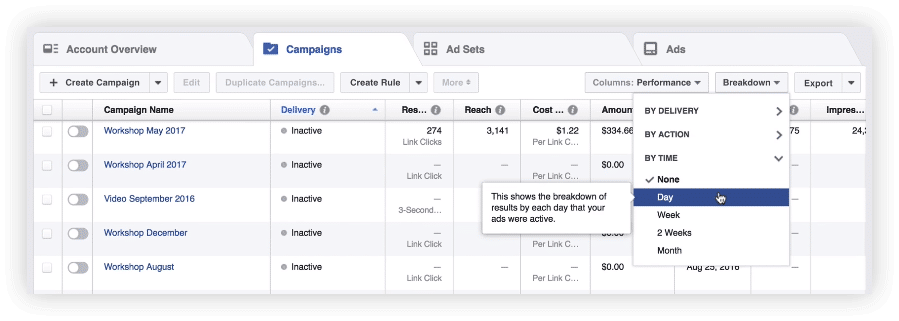

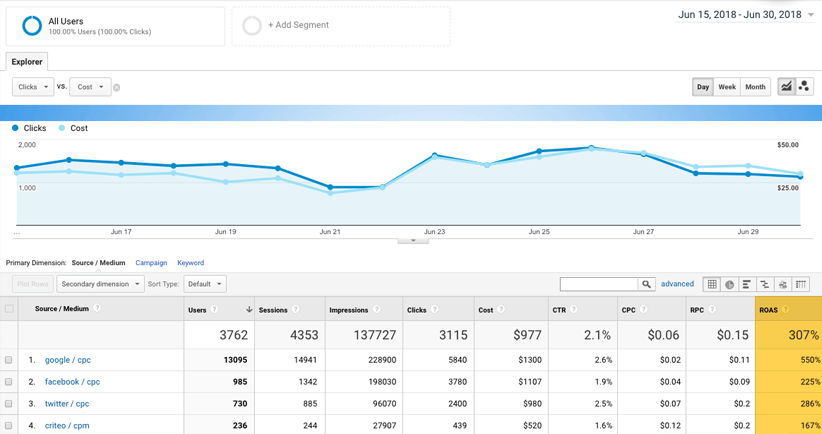
This is how you can import your Facebook ad costs into Google Analytics.
Even if you’re doing everything correctly and without errors, would you honestly like to do this each time you need a report? Or would you prefer spending 15 to 30 minutes just once setting up OWOX BI and forget about manual uploading?
With OWOX BI, you get the same report in half the time and get even better reports as a bonus! Here are the steps for setting up OWOX BI:
If you’d like to know about more end-to-end analytics, you should know about OWOX BI and how it works. You must know that end-to-end analytics is almost unattainable with a manual approach. So that’s why we suggest trying the FB → GBQ pipeline. This pipeline give you:
We encourage you to raise your ambitions. Put a rocket on your analytics to launch it to new insights. And finally, find some valuable insights for business growth zones.
We hope this article has helped you to clarify your needs and understand the possibilities of modern analytics. Good luck!