You’ve heard brands lament their shrinking organic reach, blaming Facebook’s money-hungry ad machine, hiding behind the complaints of various marketing gurus.
Yet folks like the Golden State Warriors drive 8 million impressions and 2 million clicks on a simple 15-second amateur video with no ads. And a political blog can get higher PTAT (when it still existed as a measure of engagement) than Coca-Cola.
You’d think that the more popular a post, the greater the engagement rate, right?
The old wives’ tale says that if your engagement rate is high, then you get a multiplying effect. And at some point, because you’ve gamed the algorithm, you’ve broken out and “gone viral”. Our research suggests that you shouldn’t take that notion to the bank just yet. Let’s try to debunk a few popular myths around reach.
Understanding Reach On Facebook
First off, you may be asking yourself, “what exactly does reach mean on Facebook?” and you’re not alone. When people typically refer to reach, what they’re often talking about is organic reach which is the total number of people who have seen your Facebook post without you having to pay for it. So when you post content to Facebook and your friends/fans see that content, and it doesn’t cost you a dime, they’re counted in your organic reach metric.
You also have paid reach which is the total number of people who saw your Facebook post as a result of you running a paid ad or “boosting” your post.
Lastly, you have total reach which is the total number of people on Facebook that saw your content through either organic and/or paid reach. Total Reach = Organic Reach + Paid Reach
It’s worth noting that an individual can be included in both your paid and organic reach numbers, since they may see your content through an ad (paid) and when one of their friend’s share your content (organic).
For more information on how to boost your organic reach on Facebook, check out this related post titled “Studies Suggest Videos Double Organic Reach On Facebook”.
Measuring Engagement on Facebook
If you’ve got a moderately sized presence, your posts analytics probably look something like this:
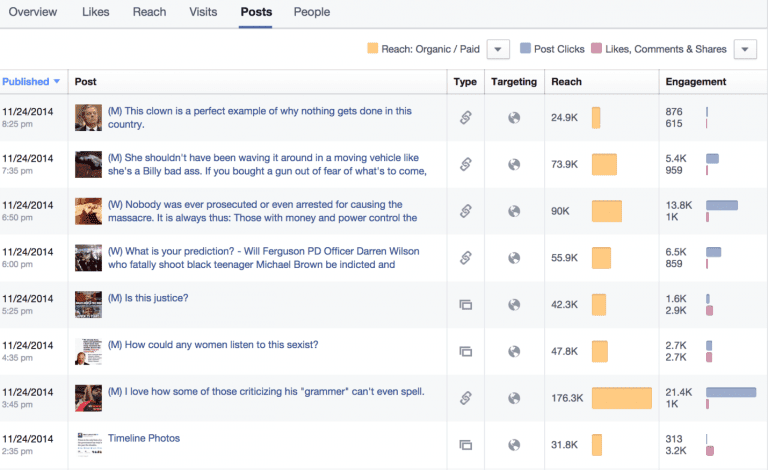 Notice that the posts with the highest reach also generally have the most interactions. But now let’s calculate the gross engagement:
- 8k clicks divided by 90k reach is 15.3 percent of total clicks.
- 4k clicks divided by 176.3k reach is 11.9 percent total clicks.
And if you keep going, you find that the posts with really high reach have a progressively lower engagement rate.
Also Read: Why kissing frogs is soooo important … A cliché revisited
How can this be?
The short answer is this: Within the first five minutes of making a post, Facebook allocates some initial reach. If this audience has high engagement, then you progressively get more reach. And like a pebble creating rippling waves in a pond, the area of the expanding circles grows.
By the time the post has exhausted its potential, you’re reaching far beyond your normal core audience. So, your engagement rate at that point is much lower than when it started.
Because averages lie, your “lower” engagement is a weighted average of the high engagement of core fans and the low engagement of the much larger audience of casual fans.
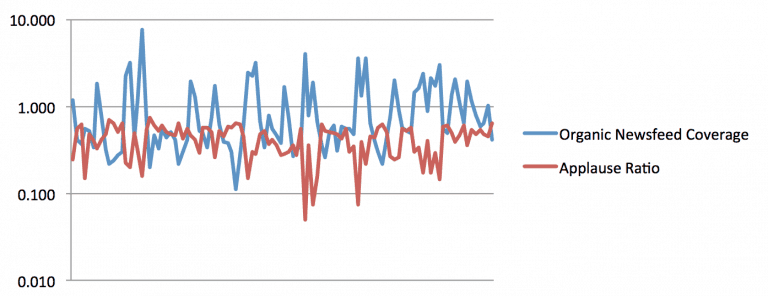
Here is daily newsfeed coverage vs. percentage of folks who are sharing (the applause ratio). You might post multiple times in one day – each of which can reach a separate or overlapping audience – but overall, the total daily unique reach has a surprising connection with total daily interactions. You might even think that Facebook is promoting unpopular or un-engaging content.
Notice the inverse relationship:
 Going Deeper Into Post-level Insights
If you’re a hardcore data geek like me, you might be interested in investigating further by downloading the CSV insights file on posts. (You can’t get organic vs. viral reach in the regular web user interface since they are now combined together as “organic”.)
Choose “post” level insights:
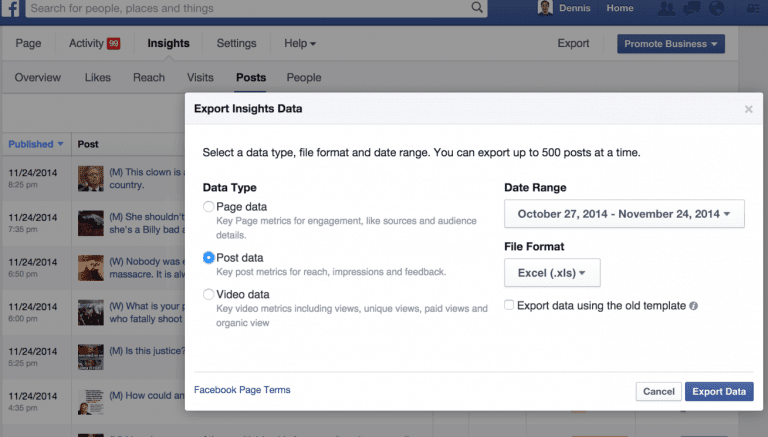 Now you can do the math to your heart’s content on impressions, reach, engaged users, negative feedback, and so forth. Facebook doesn’t make it easy, but with a little Excel magic, you’ll likely be able to determine the following insights:
- Paid reach on posts drives additional organic and viral reach/engagement. This is not Facebook favoring advertisers, but the simple matter that when you drive initial engagement – paid or not – you’ll get an organic impact over your next few posts.
- After running ads, you’ll get a residual organic effect for a few days. You can think of this as “momentum” or a recency weighting in Facebook’s algorithm. If you’re running ads on Facebook and not extending your reporting period to account for this, you’ll under-report your performance.
- Posting multiple times per day may slightly hurt reach/engagement per post, but significantly improves overall reach/engagement. In other words, look at the page-level impact. News and media organizations often post 30-40 times per day with no negative effects. Of course, this is governed by how much “quality” content you have. Look at negative feedback as a proxy.
- Facebook reports on one-, seven- and 28-day figures for non-unique metrics. Don’t make the cardinal sin of trying to add up daily reach figures over the last week to get to a weekly reach. Some of your visitors may see your content across multiple days, meaning that they are counted multiple times in daily unique reach, but only once in seven-day reach. Thus, you can’t add up daily impressions to get to weekly impressions. What you can do is add up daily impressions over the last seven days and compare to weekly reach. The difference is approximately how many impressions were repeated. The ratio between seven-day uniques and one-day uniques tells you how often people are seeing your content over multiple days.
(Note: A lot of people get lost here. Just understand that unlike web analytics where people come back once in a while, in social, you have a lot of people viewing your content in short time periods. So if you’re not looking at one-, seven- and 28 day reach trends, you won’t know which audiences are getting too much exposure to your content versus not enough.)
- If you add up daily impressions over 28 days and compare against 28-day reach, you can calculate the difference again, except this time, expect the multiple to be greater, since people are coming back more often over a longer period of time. Ironically, the lower the reach number, the better. For example, if you have 1,000 impressions each day, and you see your 28-day reach figure is also 1,000, it would mean that you had 100% retention over the 28 day period. If your 28-day reach was 14,000, then about half of the folks came back.
- Frequency is any gross metric divided by a unique metric. So impression frequency is impressions divided by reach. Engagement frequency is interactions divided by engaged users. If you do this across the one-, seven- and 28-day periods, you can paint a picture by cohort to track users over time.
Reach varies by demographics, too. Don’t like to crunch numbers in Excel? Let’s look at some charts.
Odds are your distributions will be similar to these, which are averages across a few entertainment brands. Most of your users will have a frequency of one, which means they get one impression per day or week.
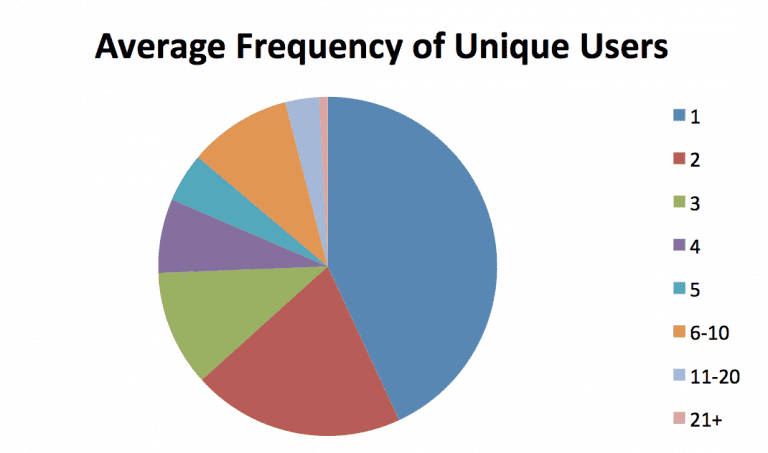 But don’t ignore those 11-20 and 20+ folks.While they might be only a couple percent of your base, they may be 20-30 percent of your impressions/engagement.They’re more likely to be avid fans who also visit your site, use your apps, are on your email list, and so forth. Identify and segment them.
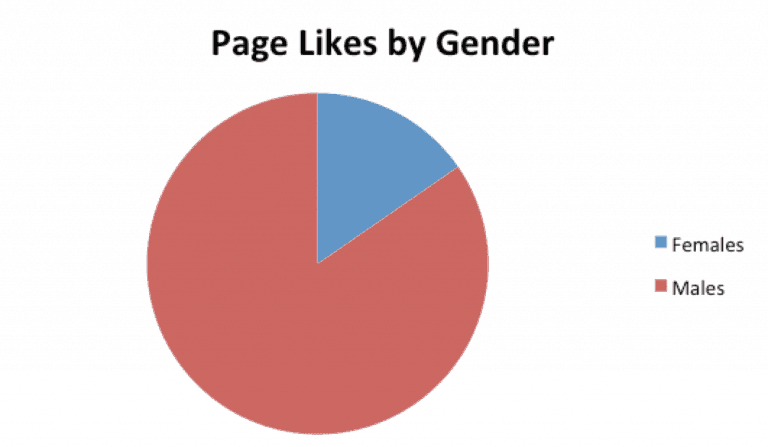
For certain brands, you may have a significant gender skew, but make sure to look at whether one gender significantly engages more:
 The same is true by age: Perhaps you have a lot of younger fans, but older demographics engage and buy more.
Impressions are an early indicator of engagement, while post frequency, seasonality and the impact of other marketing efforts drive impressions:
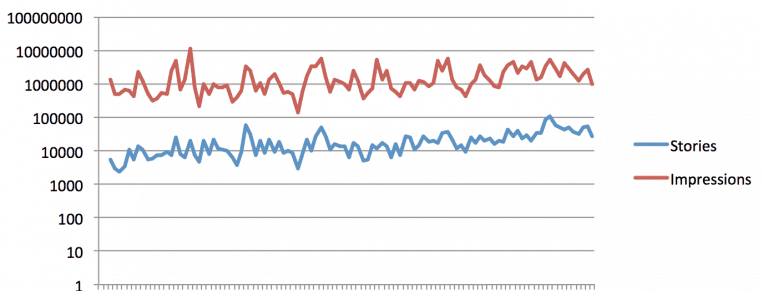 Don’t equate impressions or engagement with conversions. These are three stages in the funnel (audience, engagement, and conversion). Identify which customer segments play a role in each part.
Conclusion
Facebook provides rich insights data on how your page and posts are doing. And this has led people who are well-versed in Omniture or Google Analytics to make fundamental errors in analyzing social:
- What appears to be the “least engaging” content, expressed by interactions/reach, might actually be your best content. Engagement rate on a post changes by the time window you select— a few minutes to 28 days out.
- The window of time for reach and engagement by network, from shortest to longest are Twitter, Facebook, Instagram, Pinterest, YouTube, and website. Look at the ratio of daily unique reach versus seven-day unique reach to see whether an increase in traffic is from brand new users or returning users.
- Low reach per post is not bad if your overall page reach is strong, often via higher post frequency. So don’t worry about low organic reach per post, especially if you complement it with paid reach.
- Paid reach and organic reach will overlap—you can’t add them up for the same reason you can’t add up daily unique reach figures for seven days to get weekly unique reach.